

The EU referendum is a once-in-a-generation event- which means we have few guides for what to expect.
Chris Hanretty gives some indications of how early-reporting local authorities might vote.
No nation which thought well of politicians would invent the overnight count.
The process asks politicians- men and women who have spent weeks operating on limited sleep-to stay up through the night to find out whether or not they will have lost their job, and- in the case of particularly prominent losers- to comment on their own demise. It seems cruel to put people through this for the sake of knowing in four hours’ time what could be known in fourteen.
I don’t deny that overnight counts are dramatic. The results programmes which accompany them in particular are set-pieces of British political journalism, providing both cultural touchstones and more graphs than any other type of television is permitted.
That doesn’t mean that such programmes are easy for journalists. Pacing is difficult: there is a gap between the results of the exit poll and the first results (almost always from Sunderland); there is then a further gap between Sunderland results and the results from those parts of the country who could care less about winning first prize in a race to count disparate bits of paper.
Those issues of pacing will be even more pronounced in the forthcoming coverage of the EU referendum vote. For very many good reasons, there will be no exit poll. Nor are there any obvious points of comparison for those results which do arrive early. Even were it possible to compare results from the 382 mainland local authority areas to the results from the sixty-seven counties and nations which reported in 1975, it’s not clear that it would be desirable to do so.
This does not mean that we are entirely ignorant of how different parts of the country will vote. Political scientists and geographers have, independently and with some amount of reinvention, deployed methods of small area estimation in order to provide indications of how particular constituencies or local authorities might vote. These techniques- which are built on the back of large-scale national surveys such as the British Electoral Study– have been applied to create estimates of Euroskepticism at the constituency level, and estimates of referendum vote intention at both Westminster and local authority level.
In this post, I wanted to set out how some estimates I have created could be used to help interpret the first early results on the night. I’ve tried to be as transparent as possible in doing so. If you want to replicate what I’ve done, you can find the code that I use on GitHub. I’ve put a short technical description at the foot of this post.
There are some details that it’s necessary for you to know, even if you’re not interested in the mechanics of how these estimates are produced.
First, I created these estimates on the post-election wave of the British Election Study. The fieldwork for this wave was done in May of last year.
I use this data source because it’s the most recent publicly available source of data I have available to me. I have other private sources of data (including the data which underlies this Times infographic about how different constituencies will vote), but using private sources of data isn’t very transparent. That means that the first step in constructing these estimates is constructing estimates of opinion at the local authority level in May of last year.
Second, I’ve had to assume that referendum intentions since May of last year have changed uniformly across the country. That is, if support for Leave goes up by six percentage points nationwide, it goes up six percentage points in each different part of the country.
I’ve had to assume this because I’ve had to add on a constant to bring my local authority figures in line with the current average of the polls. The population weighted average of my local authority estimates from May 2015 was 47% for Remain, 36% for Leave, and 17% unknown. That’s quite different from the current polls. An average of the last three polls shows support for Leave and Remain deadlocked at 43% each. I’ve therefore subtracted four percent from my local authority estimates for Remain, and added seven percent to my local authority estimates for Leave.
Third, I’ve ignored the complications that arise from different patterns of turnout. Below, I give an indication of what the national levels of support for Remain and Leave might be, given such-and-such a result in area X or Y. If pro-Remain and pro-Leave areas turn out at similar rates, then this will give a good indication of the national result. But if (for example) pro-Leave areas turn out at much higher rates, these figures will be poorer guides. It’s possible to model this as results come in from areas with different leanings — but difficult to do so in a defensible manner in advance of the election. Turnout is one of the hardest things to forecast, not least because people — the good honest folk that make up this country, the stout yeomanry that will decide this contest — well, not to put to fine a point on it, they’re lying bastards.
With these qualifications in mind, let me give you the estimates for the first five mainland UK constituencies scheduled to report their results:
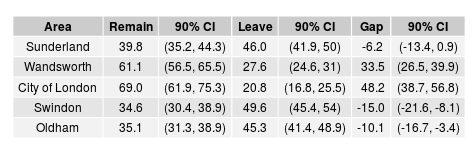
You can find the full table here.
As you can see, Sunderland, together with Swindon and Oldham, lean LEAVE. The 90% confidence intervals are large- of the order of eight to ten percentage points. Due to a paucity of respondents, the confidence intervals are even larger for the City of London, which notwithstanding is listed as the easiest area for REMAIN to win.
How can I assure you that these estimates are valid? There’s no exact comparison, but YouGov did provide some results at local education authority level. They described both the Sunderland and Oldham LEAs as “mixed”, as they are here, and Oldham as more Euroskeptic, as it is here (although Oldham’s Leave rank is lower, the gap between Leave and Remain is greater than it is in Salford). Curiously, Wandsworth is placed in the same category as Sunderland (mixed, leaning Europhile): I’d suggest that Wandsworth is not so different from the rest of Europhile London.
What’s interesting here isn’t so much the absolute levels- unless the most recent polls are on average exactly right, and nothing changes between now and the day of the referendum, then these absolute levels will change- but rather the gap between Remain and Leave. If support for leaving rises and falls uniformly across the country, then this gap provides us with a way of inferring the final result from the first few declarations.
On the basis of this data, and under the assumption that undecideds break evenly between Leave and Remain, we should expect Remain to be six percentage points behind when Sunderland declares. That means that we should expect a 53-47 win for Leave. Since these local estimates have been brought into line with polling data that suggests Leave and Remain are almost exactly tied for public support (in fact, Leave is marginally ahead), this suggests that we can take the Sunderland result for Leave and subtract three ( half the gap) in order to get a rough estimate of the national result for Leave.
I should point out at this point the number of assumptions involved in reaching this point. I have assumed that
•the geographic patterns of the Leave and Remain votes have remained
constant since May of last year (though the levels may have changed);
•that undecideds will break in roughly even numbers between the two
camps; and
•that Leave- and Remain-voting areas will vote at roughly equal
rates.
These assumptions are listed in order of how easily I suspect they will be granted. Indeed, they are all assumptions I expect to dispense with during the course of the night as more data becomes available. Nevertheless, some assumptions of this sort are necessary in order to make any inferences.
Armed with these assumptions, what can we say about what to expect on the night?
First, if the result in Sunderland is very close, then Remain has probably won. I said that we should expect Leave to be six percentage points ahead in Sunderland. That’s my best estimate of the gap in Sunderland, but it’s come with uncertainty. If, god forbid, the referendum were to be repeated 100 times, then ninety times out of one hundred I’d expect the gap to be between Leave 14 percentage points ahead and Remain one percentage point ahead. That means it’s not impossible that Leave will win whilst losing in Sunderland. But it would be difficult.
Second, we will probably have a good idea of the result by the time Lancaster reports (estimated time 3.30am). Both YouGov and my estimates concur in placing Lancaster (or in YouGov’s case, Lancashire LEA) close to the median.
Third, given that there are awkward issues to do with turnout, and no exit poll on which to base inferences on, I doubt that the BBC will call the result before 5am, and probably not before 6am. When I was live-blogging the Scottish Independence referendum, I felt able to make a definitive call at 4.25am, even though the probability of a Yes vote had been drifting downwards for some time. This referendum is, I think, likely to be closer, and the BBC is chronically risk-averse.
The bottom line is that we’ll learn an awful lot from the results- one way or another. I will be doing something on the night, though precisely what is still to be decided. If you want to close out your bets profitably, you should probably go to sleep and wake up around 4am. I’ll see you then…
Technical note: These estimates were produced by separately regressing the proportion of respondents intending to vote Leave and Remain on several local-authority level variables, together with nested random effects for local authority and region, and creating simulated predictions using the predictInterval function from the merTools package for R. No post-stratification or spatially correlated random effects were used. In a paper together with Ben Lauderdale and Nick Vivyan, I’ve shown that with a large number of areal units unit-level covariates and random effects get you very close to the estimates produced by more complicated techniques. When I compare these results with Westminster estimates, producing using post-stratification but remapped on to local authority boundaries in proportion to population, the correlation is reasonably high (r=0.88), which suggests that the different method does not create results that are very different.
This post originally featured on medium.com
Image Credit: Flickr
Dr Chris Hanretty is reader in Politics at the University of East Anglia.