The Eastern region elected 3 UKIP MEPs, 3 Conservative MEPs and 1 Labour MEP in European election in May 2014. Dr. Chris Hanretty analyses the patterns of support across the region.
The votes in last Thursday’s European elections were counted on Sunday night, and indeed are still being counted in some parts of the country.
The East of England region seems to have benefited from unusually efficient electoral administration, courtesy of Chelmsford Borough Council, who were the lead local authority for the region.
Chelmsford have put together a simple CSV spreadsheet showing the breakdown in terms of raw vote counts for each of the 48 local authorities in the region. Believe it or not, this places them head-and-shoulders above other authorities in terms of ease of re-use of their data. Most local authorities release election results as PDFs, requiring researchers to re-enter data manually.
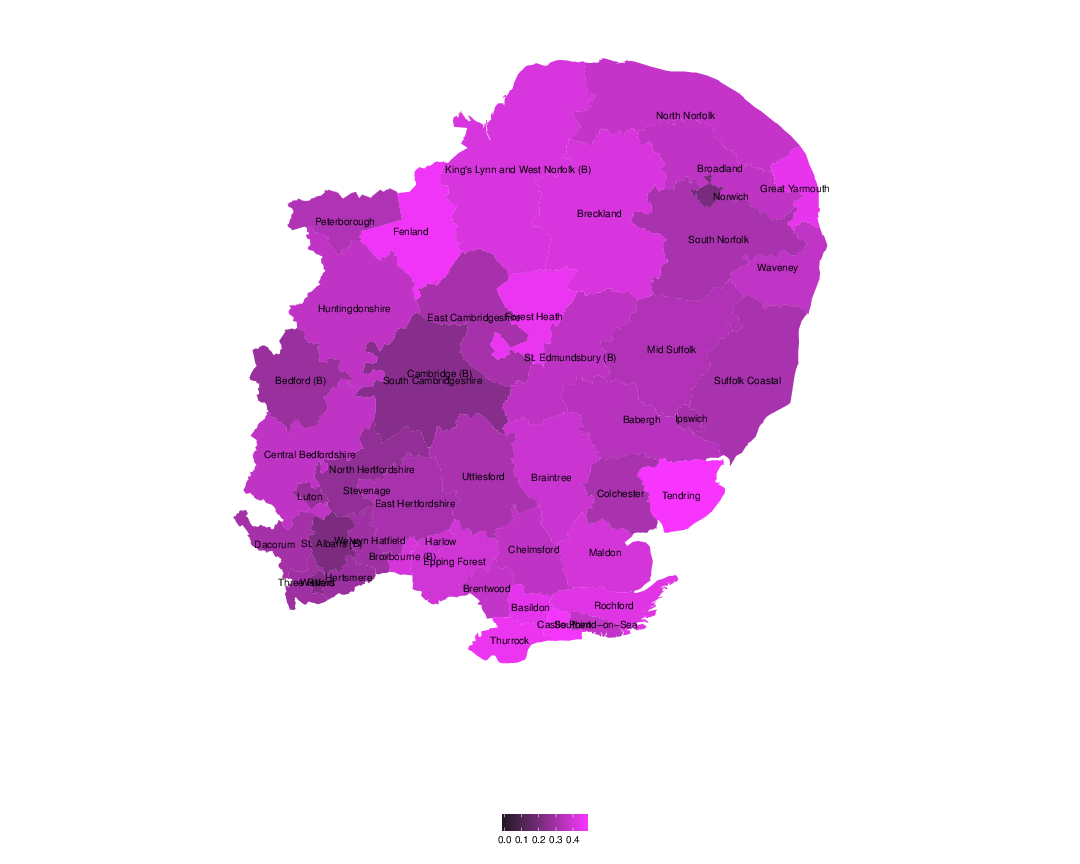
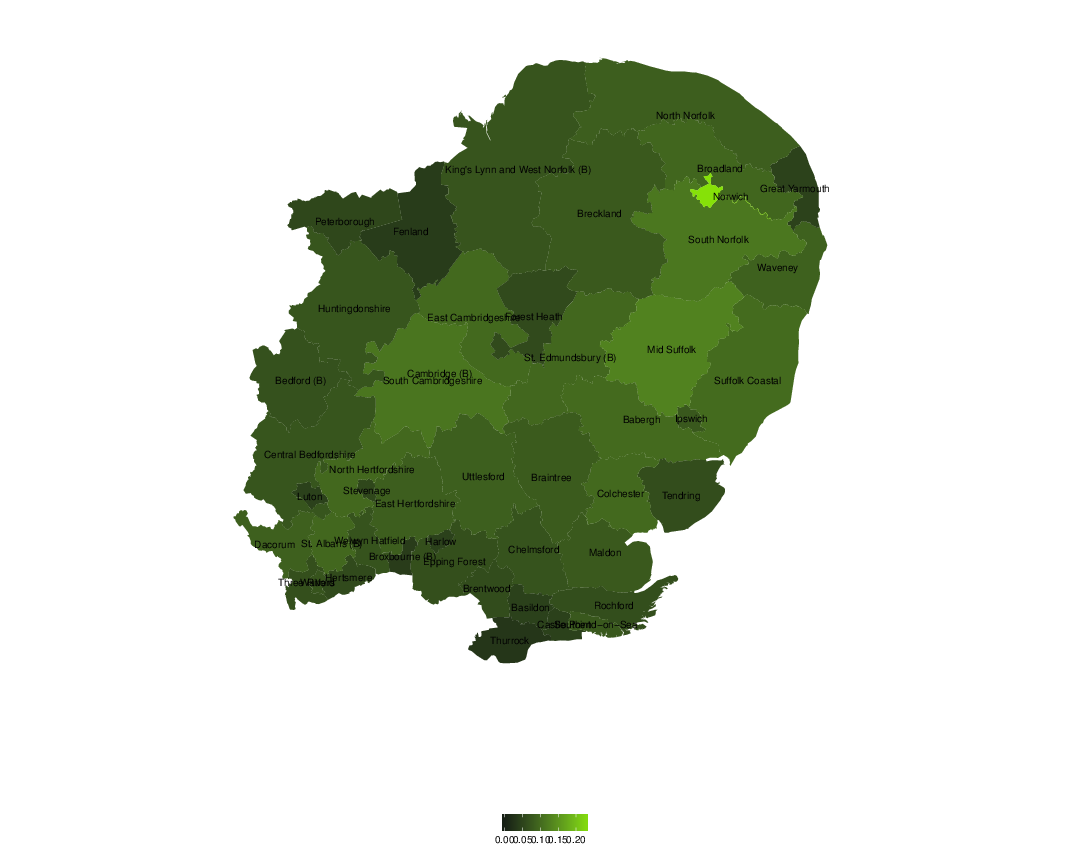
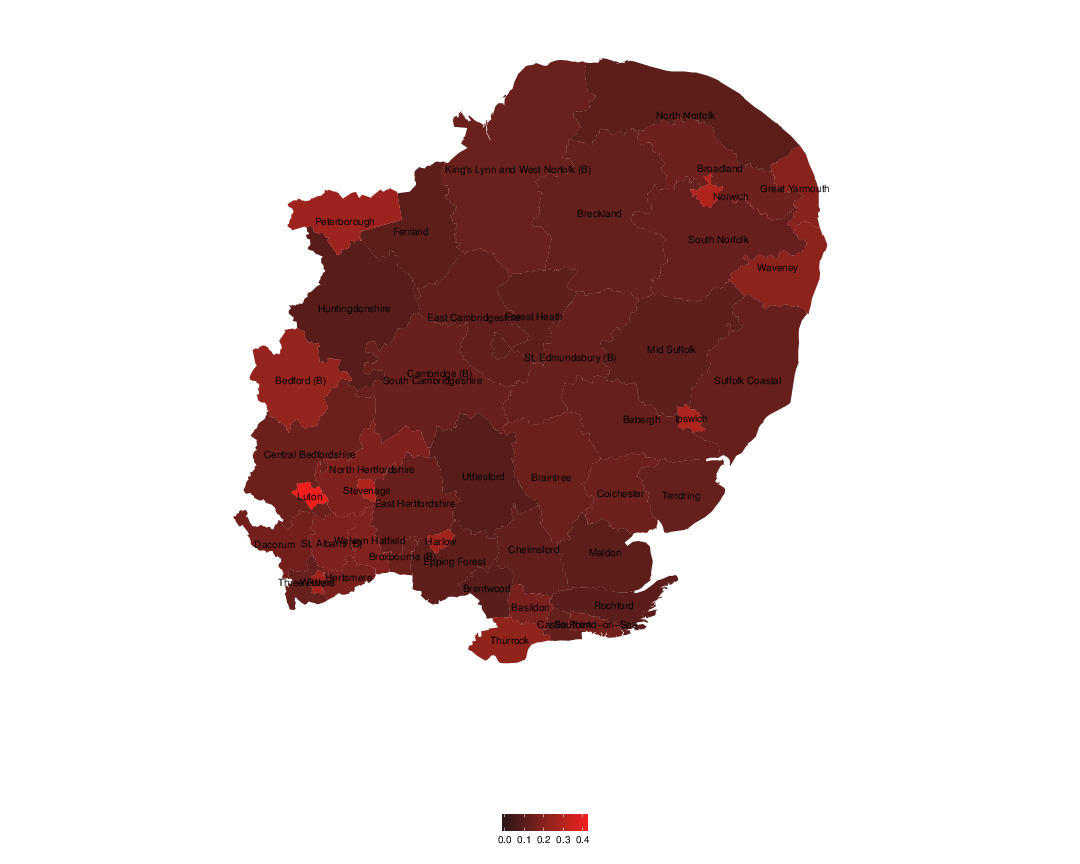
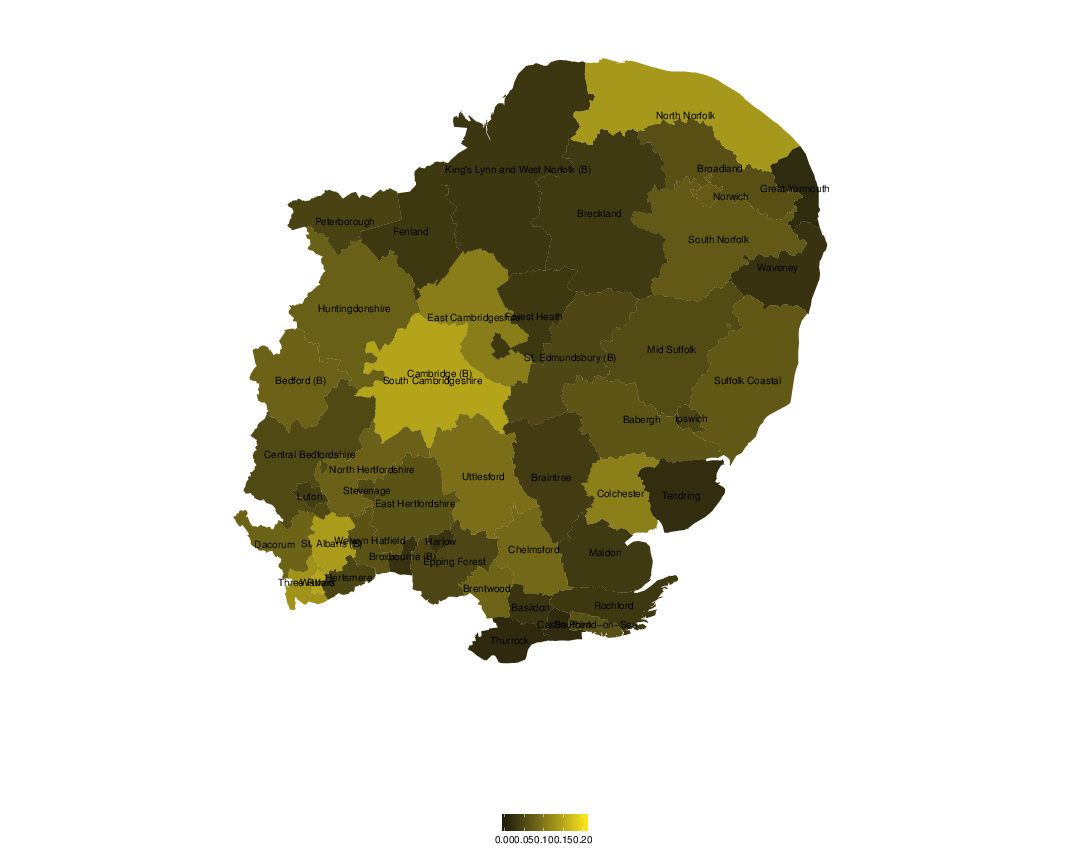
With this data in hand, it’s not too hard to map the results across the country. Here, I show the vote share of each of the five main parties (UKIP, Labour, Conservatives, Greens, Liberal Democrats) in their associated colours. Brighter shades indicate higher vote shares.

, Eastern region.

There are two main patterns of note.
The first is the urban rural split. Labour do (relatively) well in the cities, the Conservatives do (relatively) well in the countryside.
The Greens seem to do slightly better in the cities, but this is contingent on a local base. Whilst the Greens do extremely well in Norwich, they take fewer votes from Labour in, say, Luton.
The second ‘pattern’ is the rather uneven distribution of UKIP support.
UKIP isn’t alone in having ‘high-variance’ electoral support — the Liberal Democrats also display quite a large amount of variation, relative to their (low) vote share — but UKIP’s pattern is worth commenting on in particular.
To an unusual degree, UKIP does well in coastal areas. This pattern is found across the country — UKIP does very well in coastal Lincolnshire, for example. It’s also true in the East of England. Notice the spikes of support around Yarmouth and further south towards Tendring. Conversely, notice the dark inland purple patch, indicating lower support, stretching out from St Alban’s to Cambridge.
These geographical patterns are interesting — but the real work lies in uncovering the reasons why certain areas trend certain ways. Based on what we know about UKIP support, it’s likely that bright purple areas have high concentrations of older, whiter, less well-educated working class voters. That seems to fit the map — but generally to uncover these kinds of relationships it’s best to work from the individual level data itself, of the kind released by the British Election Study.
Dr. Chris Hanretty is a Lecturer in Politics at the University of East Anglia.