Legislative Studies Quarterly has just published an article written by Dr Chris Hanretty together with Ben Lauderdale (LSE) and Nick Vivyan. In this post, Chris summarizes the article’s claims about how MPs represent their constituent’s views.
Imagine a world very much like our own, where MPs are elected to the House of Commons in single member constituencies, but where MPs don’t represent the constituencies that elect them- where instead, the first day of the parliamentary session is taken up by the reading out of parliamentary constituencies, and the drawing of names from a hat. Strange results would arise- English constituencies might find they had a real chance of being represented by an MP from the SNP, and many Labour heartlands would end up being represented by true blue Tories.
In this world, there wouldn’t be any association between the views of each constituency, and the views of the MP representing that constituency. There couldn’t be-if there was some association, it would show that the process of drawing names out of a hat hadn’t been truly random.
Our world is very different from this imaginary world, in ways that we can readily point to. In our world, Labour heartlands (usually) elect Labour MPs, and Labour heartlands and Labour MPs think differently about issues from Conservative heartlands and Conservative MPs.
But what if we were comparing things to a slightly different world- a world where constituencies elected MPs, but where MPs from the same party were randomly shuffled around. We’d see an association between the views between of each constituency and the views of each MP- Conservative voting areas and Conservative MPs would still see things differently from Labour voting areas and Labour MPs- but that association would only exist across parties, and not within parties.
It wasn’t clear to me, a while ago, that our world was very different from this second, imaginary world. Three years ago, I would have been prepared to believe that voters just picked a party label, and that it was the luck of the draw whether they got an MP who was close to their views than the average MP from that party. After all, who amongst us bothers to check out our MPs’ voting records and decides to vote on that basis?
Now my views are slightly different, because together with Ben Lauderdale and Nick Vivyan I’ve carried out research into the association between constituency preferences and MP positions. In a recently published paper in Legislative Studies Quarterly, we carried out several studies of the association between constituency positions and MP positions
•on the general left-right scale;
•on the issue of same-sex marriage; and
•on the issue of Europe
for the 2010 to 2015 parliament. Our measures of constituency positions were taken from large- scale surveys which we combined with auxiliary information from the census and information about constituency geography. All the measures are explained in the paper, which is free to read (open access FTW!).
On left-right issues
The figure below shows, on the horizontal axis, the position of each constituency on the left-right scale. The vertical axis shows the position of each MP on a left-right scale; these positions are based on the pattern of signatures for Early Day Motions, so that MPs who signed the same motions, and who generally signed motions at similar rates, are closer together than MPs who never signed the same motion.
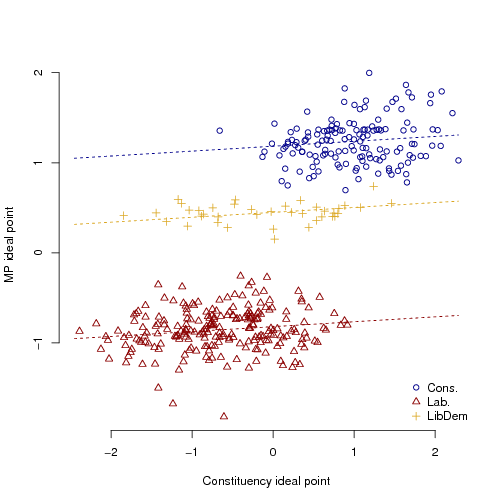
The numbers on the axes aren’t meaningful- they’ve been scaled, so that the average position is zero. You’ll notice that MPs from the same party are clustered tightly, and that more left-wing constituencies are more likely to elect Labour MPs. But when we pay attention to the trends within each party (indicated by the dotted line) we see there’s a link between constituency position and MP position. The link isn’t huge, but it is statistically significant.
On same-sex marriage
The figure below shows, on the horizontal axis, the percentage support in each constituency for same-sex marriage. On the vertical axis, we see how the MP from that constituency voted on the second reading of the Marriage (Same Sex Couples) Bill: if they supported the bill, they’re in the top cluster; if they opposed it, they’re in the bottom cluster.

The lines going through the graph show the trend for each party. These trends are fairly important. If we just focus on the Conservatives (since they’re the party which was most split on the issue), then moving from average constituency support for same-sex marriage (58.3% in support) to high support (63.5%) results in a change in the predicted probability of supporting the measure of approximately 10%.
On the issue of Europe
The second reading of the same-sex marriage Bill was useful to us because it gave us insight into how MPs behave when they’re not subject to the party whip. In our study of constituency and MP positions on Europe, we looked at Euroskeptic rebellions, so that we could show that we weren’t just finding this pattern in (rare) free votes.
In the figure below, you can see constituency Euroskepticism (or the proportion of people who disapprove of the EU) on the horizontal axis plotted against the predicted probability of rebelling in a whipped vote on Europe in which there was some rebellion. Most MPs don’t rebel, so the cluster at the bottom is fairly thick- but there’s a strong relationship between constituency Euroskepticism and rebellion.

It’s (partial) correlations all the way down…
We’ve shown, in our article, certain patterns that relate the way that constituencies feel about issues to the way their MPs feel, as revealed by different types of parliamentary behaviour. We think that’s an important contribution, which builds on the work we’ve done in estimating opinion at the constituency level, and which dispels this idea that candidates from the same party but different constituencies are really like peas in a pod. But there’s another question which lies behind this question- if there is a link between how constituencies feel and how MPs feel, what explains that pattern?
We tried lots of obvious candidates- we tried investigating whether the link was stronger in more marginal seats, or stronger with more “local” MPs, or weaker with candidates who had been parachuted in- but all of these obvious candidates didn’t seem to make a difference. That’s fine- we wouldn’t want to deprive ourselves of the standard academic claim that more research is needed. Oh, and more free votes would be good too, if the whips could arrange it for us….
Technical note: replication materials- including the constituency positions and how MPs voted – are available at my website.
Dr Chris Hanretty is Reader in Politics at the University of East Anglia
This post originally featured on medium.com
Image credit: Flickr