
For tonight’s Newsnight, Chris Hanretty looks at NHS performance and election outcomes. Here, he explains his findings and how to access the data.
Labour has made the NHS the main theme of its general election campaign.
It’s used the NHS as a stick with which to beat the government over the head.
But is that campaign paying electoral dividends?
At the national level, it’s difficult to tell. The long waiting times in A&E departments across the country didn’t seem to cause a surge in Labour support. But then that was over Christmas, when pollsters, like many other people, take some time off.
But at the constituency level, we can start investigating whether Labour’s strategy is paying off. Are constituencies where the NHS is doing worse, more likely to turn to Labour?
The NHS publishes a number of measures of NHS performance. Two important measures are the proportion of A&E patients seen within four hours, and whether staff working in a hospital would recommend it to friends a family.
We expected that constituencies with poorer-performing hospitals on these measures would be more likely to swing to Labour. But that’s not what we found. Here’s a graph of average constituency performance on A&E targets, against Labour swing. The line of best fit is plotted in red.
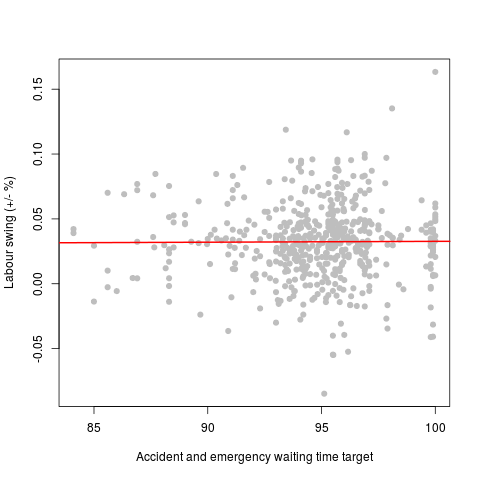
That line’s as flat as a pancake. Labour’s not benefitting.
What is interesting is to switch party. Here’s another graph, showing the swing Labour, but for UKIP. We’ve also changed the horizontal axis, so it shows the percentage of staff who’d recommend their own hospital.
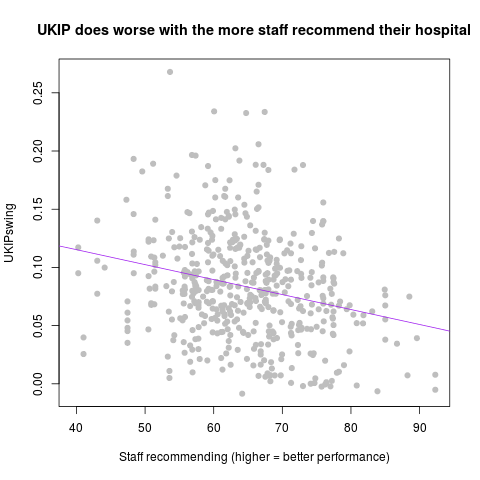
UKIP seem to be doing worse in areas where more staff recommend their hospital — or, slightly differently, UKIP are doing better where the NHS is struggling to convince even those who work for it. Note that the UKIP pattern we find here shows up in staff recommendations, and standardized mortality data — but not in A&E performance or patient recommendations.
The logic behind Labour’s decision to concentrate on the NHS is sound.
People do judge the NHS to be an important issue in deciding how they vote.
The more voters think that the NHS is at risk, the less likely they are to support the government.
But the flaw in Labour’s argument may be that whilst voters in areas where the NHS is performing poorly are less likely to support the government, that doesn’t necessarily mean that those disgruntled voters are going to flock to Labour.
Attacking the government on its record can lead to gains for your party — but it can also lead to gains for other more critical opposition parties.
Technical details:
To download an Excel spreadsheet of these measures, click here. To download a zipped archive containing replication materials and R scripts, click here. These materials contain the results of regressions using different measures of performance.
For constituency with hospitals in their boundaries, we calculated the mean levels of performance on four different criteria:
- Percentage of A&E patients seen within 4 hours
- Standardized hospital mortality rate; higher figures indicate higher mortality
- Staff survey score for satisfaction with standard of care if a friend or relative needed treatment.
- The proportion of people who would recommend this hospital to friends or family
For constituencies without hospitals in their boundaries, we averaged over the values of neighbouring constituencies.
We then matched this with the estimates of swings towards/away from different parties, taken from http://www.electionforecast.co.uk
Feature photo, “Hospital” is copyright (c) 2011 Ralph and made available under a Attribution-Noncommercial-Share Alike 2.0 license