

Want to work out the outcome of the referendum before all of the results are in? Dr. Chris Hanretty shows how the outcome will be predictable from the early declarations.
It’s 10pm on Thursday 18th September. The polls in the Scottish independence referendum have just closed. You’re anxious to know whether Scots have voted for independence — but you’d like to know before 6:30 the next morning. (Maybe you have some large foreign currency trades to execute).
Thankfully, using our handy cut-out-and-keep guide to each local authority area, you can start making informed guesses about the likely outcome as soon as the first partial results come in.
The graph below gives a figure for each of the 32 local authority areas in Scotland. (Take a look at Alasdair Rae’s blog if you’re not sure where these places are).
- The further to the right the local authority is, the more that area leans towards Yes.
- The further to the left, the more that area leans towards No.
By taking the result for each authority, and subtracting the figure you see plotted on the graph, you can estimate the national share of the vote for Yes. A worked example follows.
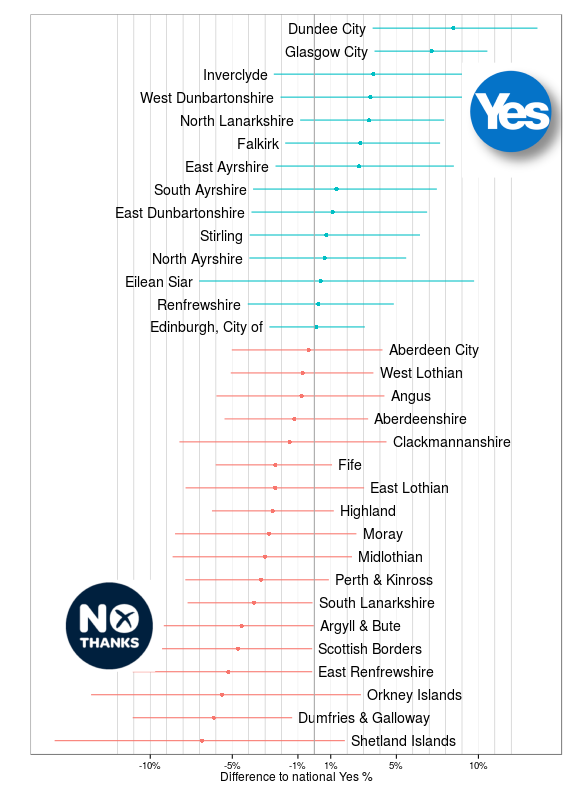
Accounts on when each local authority area will report differ. But let’s suppose that North Lanarkshire — one of the more favourable areas for Yes, according to the graph — is one of the first areas to report at 2:00am. Let’s also suppose that North Lanarkshire reports a vote of 51 percent yes. In that case, take 51%, and subtract the figure for North Lanarkshire (3.3%). Our best guess about the national figure would therefore be 47.7%.
You might, of course, prefer a different result. That’s why the graph also shows the confidence intervals attached to each local authority area. Although our best guess is that the Yes vote in North Lanarkshire will be 3.3% ahead of the Yes vote nationwide, it’s most likely to be somewhere in a range between 8% ahead, and and half a percent behind. The more local authority areas report, the clearer the picture will become.
| Area | Difference | Low-end figure | High-end figure |
|---|---|---|---|
| Shetland Islands | -6.83 | -15.83 | 1.86 |
| Dumfries & Galloway | -6.13 | -11.07 | -1.35 |
| Orkney Islands | -5.62 | -13.61 | 2.84 |
| East Renfrewshire | -5.24 | -11.07 | -0.13 |
| Scottish Borders | -4.66 | -9.28 | -0.13 |
| Argyll & Bute | -4.44 | -9.18 | -0.03 |
| South Lanarkshire | -3.68 | -7.73 | -0.11 |
| Perth & Kinross | -3.25 | -7.86 | 0.89 |
| Midlothian | -3.01 | -8.64 | 2.29 |
| Moray | -2.77 | -8.49 | 2.56 |
| Highland | -2.54 | -6.24 | 1.19 |
| East Lothian | -2.39 | -7.85 | 3.03 |
| Fife | -2.38 | -6.01 | 1.08 |
| Clackmannanshire | -1.50 | -8.22 | 4.40 |
| Aberdeenshire | -1.22 | -5.47 | 3.28 |
| Angus | -0.78 | -5.97 | 4.27 |
| West Lothian | -0.71 | -5.09 | 3.60 |
| Aberdeen City | -0.35 | -5.03 | 4.15 |
| Edinburgh, City of | 0.13 | -2.74 | 3.08 |
| Renfrewshire | 0.24 | -4.06 | 4.84 |
| Eilean Siar | 0.38 | -7.02 | 9.74 |
| North Ayrshire | 0.64 | -3.96 | 5.60 |
| Stirling | 0.73 | -3.94 | 6.44 |
| East Dunbartonshire | 1.12 | -3.83 | 6.88 |
| South Ayrshire | 1.35 | -3.73 | 7.47 |
| East Ayrshire | 2.73 | -2.37 | 8.50 |
| Falkirk | 2.80 | -1.78 | 7.66 |
| North Lanarkshire | 3.33 | -0.86 | 7.92 |
| West Dunbartonshire | 3.42 | -2.06 | 10.32 |
| Inverclyde | 3.59 | -2.47 | 10.69 |
| Glasgow City | 7.16 | 3.67 | 10.55 |
| Dundee City | 8.46 | 3.55 | 13.60 |
Technical details
To arrive at these figures, I started with the data from the second wave of the British Election Study. This has information from 6971 Scottish respondents, of whom 5467 expressed their intention to vote for Yes or No in the referendum.
Using this BES data, it is possible to find out the raw percentage of respondents in each area who support Yes. Unfortunately, because the sample size in each local authority area is limited, these percentages might provide a poor guide to outcomes. It’s desirable to include other information in order to firm up these estimates. I used information on the percentage vote share for the SNP in the last local elections, and the population density of the local authority area. I then modelled the relationship between these two factors and the likelihood of respondents saying yes. I also allowed the baseline probability of voting yes to vary across areas, such that adjoining local authority areas would be more similar.
(To use the technical jargon, I performed small area estimation using unit-level predictors and spatially autocorrelated random effects.)
This gave me a predicted percentage Yes vote in each local authority area. However, the fieldwork for the BES second wave was carried out some time ago, and since that time the polls have narrowed. I therefore subtracted the sample average (0.432) from each number. This gives the departure from the national figure. These figures will provide a good guide to the national outcome as long as the changes we see in the polls are the result of a uniformly national swing since the date of the BES fieldwork.
You can find the R source code used to generate these figures here. You’ll need to download the BES data, shapefiles from Ordnance Survey, and a spreadsheet showing auxiliary information on these local authority areas.
Dr. Chris Hanretty is a Reader in Politics at the University of East Anglia.


Great post, Chris. But are you discouraging election addicts from the rite-of-passage-all-night-marathon to find out the result?
No, I think it’ll take until 5am for the direction to be clear, and final confirmation won’t come before 6:30am. That’s a long enough night for most.
Orkney result is off the scale, isn’t it? 33% yes.